Difference between revisions of "TL Test BarData"
Jump to navigation
Jump to search
| Line 8: | Line 8: | ||
TimeAxis = orientation:horizontal | TimeAxis = orientation:horizontal | ||
PlotArea = right:10 left:10 bottom:20 top:0 | PlotArea = right:10 left:10 bottom:20 top:0 | ||
| + | |||
Colors = | Colors = | ||
id:bg value:white | id:bg value:white | ||
| Line 39: | Line 40: | ||
PlotData= | PlotData= | ||
| − | + | align:center textcolor:black fontsize:9 mark:(line,black) width:25 shift:(0,-5) | |
color:ceo | color:ceo | ||
| − | |||
| − | |||
| − | |||
| − | |||
| − | |||
| − | |||
| − | |||
| − | |||
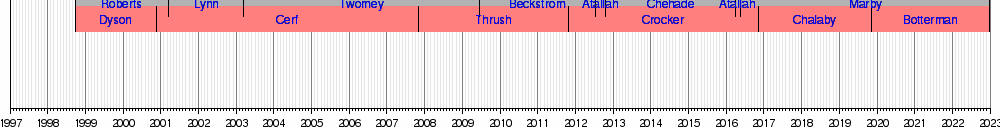
bar:CEO from:10/01/1998 till:03/15/2001 text:"[[Mike Roberts|Roberts]]" | bar:CEO from:10/01/1998 till:03/15/2001 text:"[[Mike Roberts|Roberts]]" | ||
bar:CEO from:03/15/2001 till:03/15/2003 text:"[[Stuart Lynn|Lynn]]" | bar:CEO from:03/15/2001 till:03/15/2003 text:"[[Stuart Lynn|Lynn]]" | ||
Revision as of 19:18, 15 September 2021